Premier League Analysis: Holding Steady in the League Table
Posted by Aly Sivji in Data Analysis
Summary
- Gather historical Premier League data
- Analyze results to generate standings at any given time
- Find teams that held the same position in the league table for longer than Manchester United's 104 days in 6th place (2016-17 PL season)
One of the biggest stories of the 2016-17 Premier League season has been the rise fall stationary grace of Manchester United Football Club. United had claimed sole position of 6th place for 104 consecutive days. This included a 17 game unbeaten streak where the clubs ahead of and behind them did everything in their power to keep pace with the consistent Red Devils.
Unsurprisingly, the Internet has turned United's stranglehold on 6th into one of this season's spiciest memes.
It also got me thinking: which team has the dubious distinction of holding the same position in the league table for longer than Manchester United? If you'll allow me: let's not let Manchester United's 6th place reign distract us from the fact that the Golden State Warriors blew a 3-1 lead in the NBA finals.
Let's use our PyData skills and find an answer!
Suggested Reading
Wikipedia entry on the Premier League.
TL;DR
- Each team plays every other team: once at home, once away
- Points awarded: Win=3, Draw=1, Loss=0
- Teams are ranked by Total Points, Goal Difference, and then Goals Scored
Examining the Problem
The hardest thing in Data Science is asking the right question.
Let's take a closer look at our problem so we can get a sense of:
- the kind of data we need to gather
- the workflow we need to follow to answer our question
- the metrics we will use to judge success
- i.e. when do we consider our analysis to be complete?
Working backwards from our desired result gives us the following workflow for our analysis:
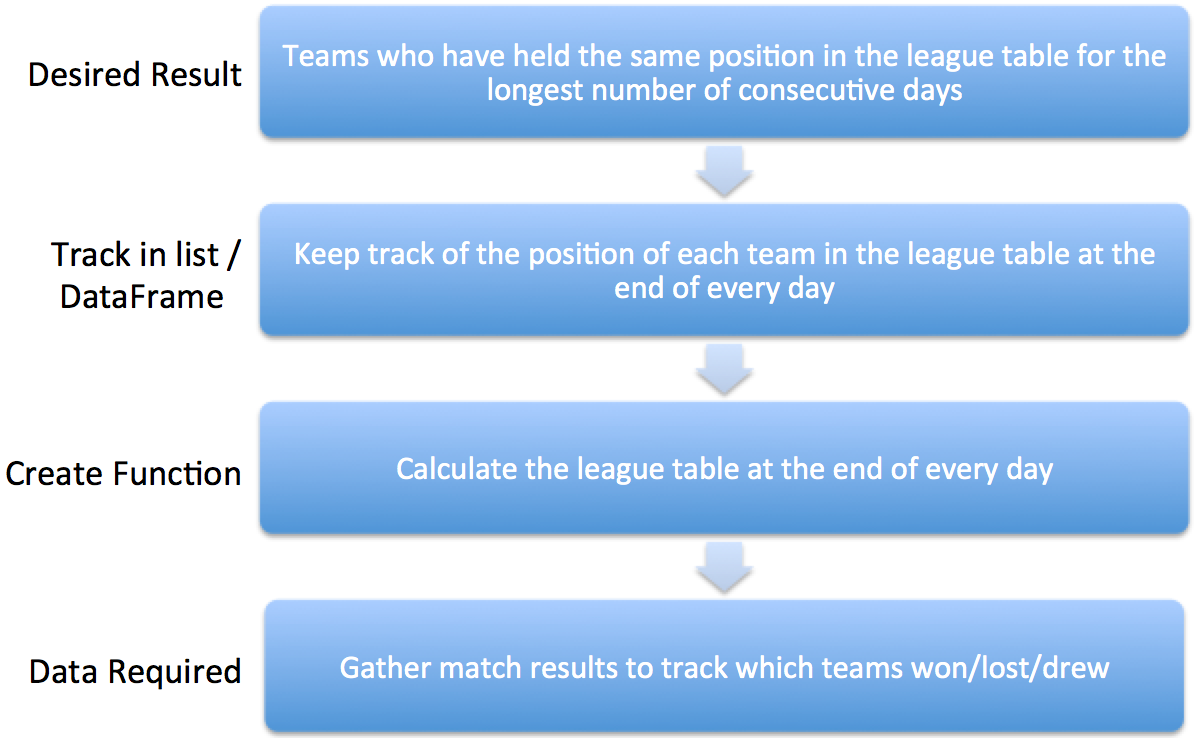
Premier League Data Analysis
Gathering Data
There are a ton of data sources available for us to use. For our analysis, we will be using match results from football-data.co.uk.
Let's download the file which contains results from the 2016-17 Premier League season.
!mkdir data
!wget -P data/ http://www.football-data.co.uk/mmz4281/1617/E0.csv
Setting Up Environment
import math
import numpy as np
import pandas as pd
Loading Data
After glancing at the data notes and our csv, we will load data into a pandas DataFrame:
results = pd.read_csv(
    'data/E0.csv',
    usecols=[x for x in range(11)],
    parse_dates=['Date'],
    dayfirst=True)
results.head()
Wrangling Data
As previously mentioned, we are using a match results dataset to conduct our analysis. Each row in this DataFrame represents a single match result. Leaving data in this format will make it difficult to write idiomatic pandas expressions to slice-and-dice our DataFrame later on.
Why? Going back to our workflow diagram, we require a function to calculate the league table at the end of each day. In its current format, we would need to iterate over our data a total of 2 times: once to calculate results when current_team == HomeTeam and, the second time, when current_team == AwayTeam.
A better data structure would have each row in our DataFrame represent a result for each team, regardless of whether they are playing home or away. We can use the pandas.melt() function to transform our data as follows:
## converting each matchup into 2 rows
## one where each team is 'current_team' and opponent is identfied
results['H'] = results['HomeTeam']
results['A'] = results['AwayTeam']
cols_to_keep = ['Div', 'Date', 'HomeTeam', 'AwayTeam', 'FTHG',
                'FTAG', 'FTR', 'HTHG', 'HTAG', 'HTR', 'Referee']

team_results = pd.melt(
    results,
    id_vars=cols_to_keep,
    value_vars=['H', 'A'],
    var_name='Home/Away',
    value_name='Team')

team_results['Opponent'] = np.where(team_results['Team'] == team_results['HomeTeam'],
                                    team_results['AwayTeam'],
                                    team_results['HomeTeam'])
team_results.head(2)
We need to transform 'home' and 'away' goals to goals scored for each team and then calculate a result given the combined score. This is also a good spot to calculate how many points the team was awarded for the match result.
We will use this post from StackOverflow (Praise Be) as a guide and proceed as follows:
points_map = {
    'W': 3,
    'D': 1,
    'L': 0
}

def get_result(score, score_opp):
    if score == score_opp:
        return 'D'
    elif score > score_opp:
        return 'W'
    else:
        return 'L'
# full time goals
team_results['Goals'] = np.where(team_results['Team'] == team_results['HomeTeam'],
                                 team_results['FTHG'],
                                 team_results['FTAG'])
team_results['Goals_Opp'] = np.where(team_results['Team'] != team_results['HomeTeam'],
                                     team_results['FTHG'],
                                     team_results['FTAG'])
team_results['Result'] = np.vectorize(get_result)(team_results['Goals'], team_results['Goals_Opp'])
team_results['Points'] = team_results['Result'].map(points_map)

# 1st half goals
team_results['1H_Goals'] = np.where(team_results['Team'] == team_results['HomeTeam'],
                                    team_results['HTHG'],
                                    team_results['HTAG'])
team_results['1H_Goals_Opp'] = np.where(team_results['Team'] != team_results['HomeTeam'],
                                        team_results['HTHG'],
                                        team_results['HTAG'])
team_results['1H_Result'] = np.vectorize(get_result)(team_results['1H_Goals'], team_results['1H_Goals_Opp'])
team_results['1H_Points'] = team_results['1H_Result'].map(points_map)

# 2nd half goals
team_results['2H_Goals'] = team_results['Goals'] - team_results['1H_Goals']
team_results['2H_Goals_Opp'] = team_results['Goals_Opp'] - team_results['1H_Goals_Opp']
team_results['2H_Result'] = np.vectorize(get_result)(team_results['2H_Goals'], team_results['2H_Goals_Opp'])
team_results['2H_Points'] = team_results['2H_Result'].map(points_map)
# Drop unnecessary columns and sort by date
cols_to_drop = ['HomeTeam', 'AwayTeam', 'FTHG', 'FTAG', 'FTR', 'HTHG', 'HTAG', 'HTR']
team_results = (team_results
                    .drop(cols_to_drop, axis=1)
                    .sort_values(by=['Date', 'Referee']))
team_results.head()
Calculating League Table (Standings Table)
# Testing the standings function against real world data
(team_results
.groupby('Team')
.sum()['Points']
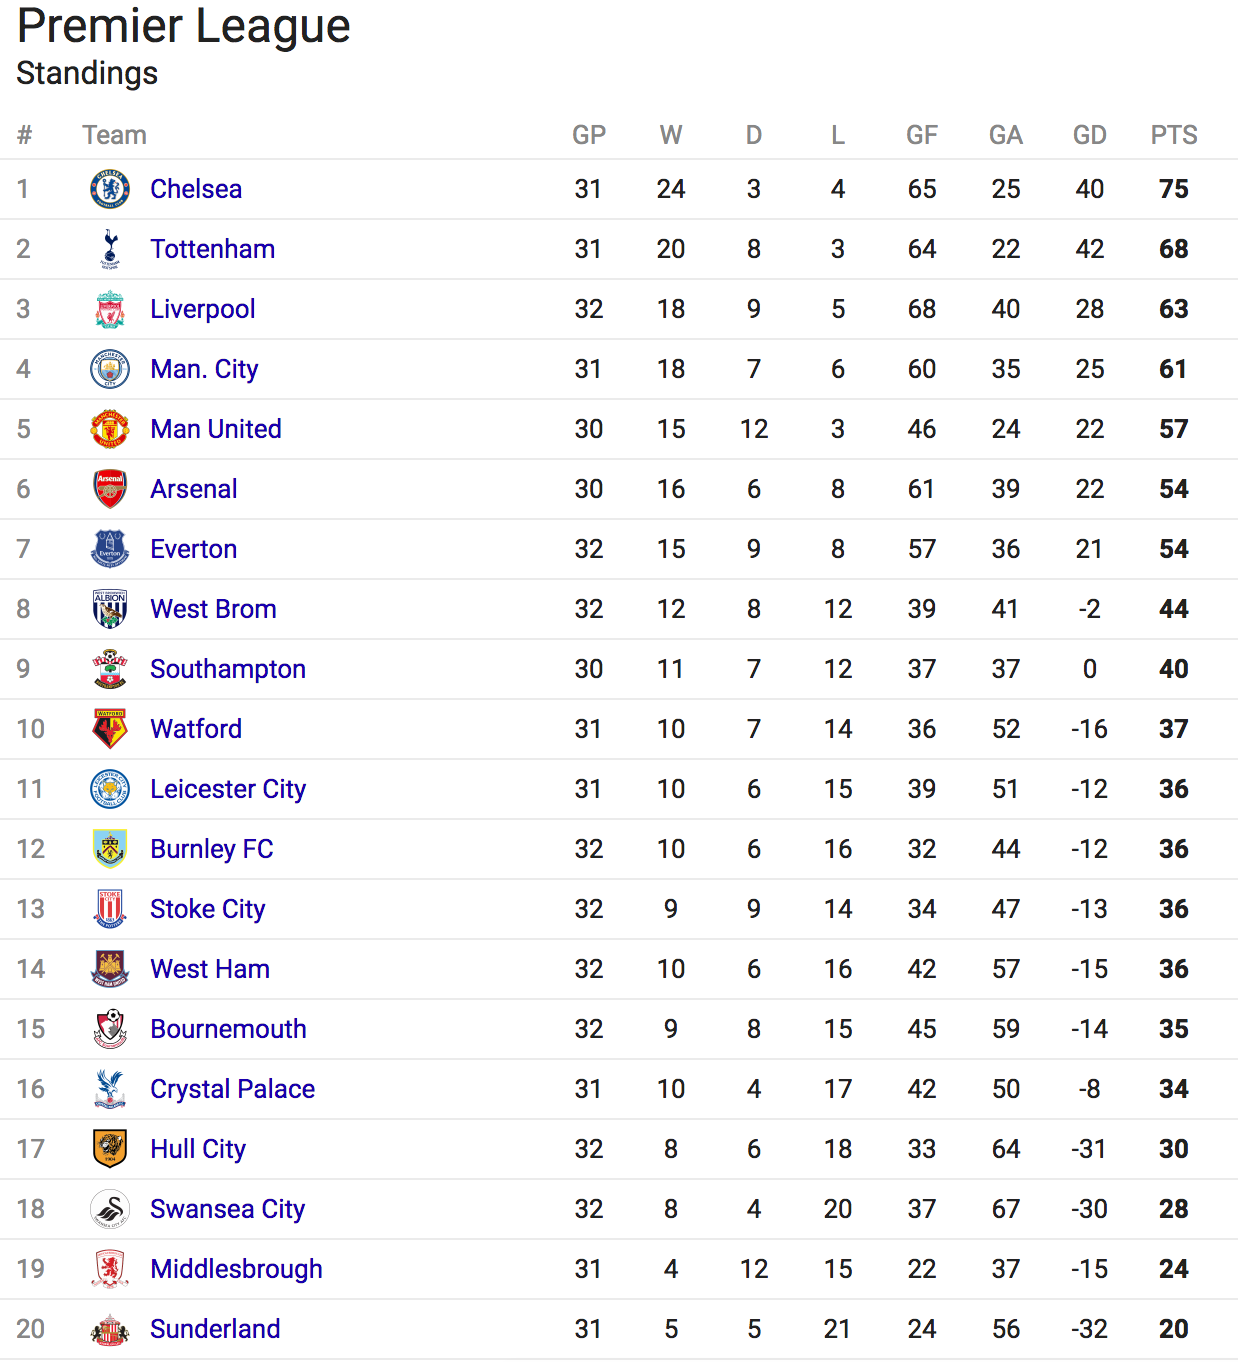
.sort_values(ascending=False))
This matches the current table (as of April 10 2017)
def standings(frame, result_col, goals_col, goals_opp_col, points_col):
    """This function takes in a DataFrame and strings identifying fields
    to calculate the league table.

    Making it generalized will allow us to calculate league tables for
    First Half Goals only. Second Half Goals only.
    """
    record = {}

    record['Played'] = np.size(frame[result_col])
    record['Won'] = np.sum(frame[result_col] == 'W')
    record['Drawn'] = np.sum(frame[result_col] == 'D')
    record['Lost'] = np.sum(frame[result_col] == 'L')
    record['GF'] = np.sum(frame[goals_col])
    record['GA'] = np.sum(frame[goals_opp_col])
    record['GD'] = record['GF'] - record['GA']
    record['Points'] = np.sum(frame[points_col])

    return pd.Series(record,
                     index=['Played', 'Won', 'Drawn', 'Lost', 'GF', 'GA', 'GD', "Points"])
# Get League Table
results_byteam = team_results.groupby(['Team'])

(results_byteam
     .apply(standings,
            result_col='Result',
            goals_col='Goals',
            goals_opp_col='Goals_Opp',
            points_col='Points')
     .sort_values('Points', ascending=False))
# Get League Table for First Half Goals only
(results_byteam
     .apply(standings,
            result_col='Result',
            goals_col='Goals',
            goals_opp_col='Goals_Opp',
            points_col='Points')
     .sort_values('Points', ascending=False))
# Get League Table for Second Half Goals only
(results_byteam
     .apply(standings,
            result_col='Result',
            goals_col='Goals',
            goals_opp_col='Goals_Opp',
            points_col='Points')
     .sort_values('Points', ascending=False))
Ranking Teams
We can use the DataFrame.rank() method to rank each team based on Premier League tiebreaks (Total Points -> Goal Difference -> Goals Scored).
# Rank Teams in Standings
league_table = (results_byteam
                    .apply(standings,
                           result_col='Result',
                           goals_col='Goals',
                           goals_opp_col='Goals_Opp',
                           points_col='Points')
                    .sort_values(by=['Points', 'GD', 'GF'], ascending=False))
league_table['rank'] = (league_table
                            .apply(lambda row: (row['Points'], row['GD'], row['GF']), axis=1)
                            .rank(method='min', ascending=False)
                            .astype(int))
league_table
Fantastic! This is the exact ranking we see online!
This is great, but there is one problem. How do we rank teams at the start of the season when some have played a game while others have not?
The pandas.rank() function will work most of the time, except for the edge case where not every team has completed their first game. We will need to take this into account when create our custom rank_teams() function.
def rank_teams(league_table, team_list):
    """Return a Series of ranked teams, including those who have yet to play

    Args:
        * league_table - League Table DataFrame
        * team_list - List of all teams in league
    """

    # sort by tiebraker and rank
    team_rank = (league_table
                     .apply(lambda row: (row['Points'], row['GD'], row['GF']), axis=1)
                     .rank(method='min', ascending=False)
                     .astype(int))

    # if not all teams are ranked (i.e. some of them might have not have played yet)
    if team_rank.size < len(team_list):
        # get all teams that need to be added to the table
        ranked_teams = team_rank.index.values
        teams_to_add = {team for team in team_list if team not in ranked_teams}

        # position to rank remaining teams
        rank_to_assign = team_rank.size + 1

        # add teams that haven't played a game to rankings
        team_pos = {}
        for team in teams_to_add:
            team_pos[team] = rank_to_assign
        team_rank = team_rank.append(pd.Series(data=team_pos))

    return team_rank
# Let's test our function to make sure it works
all_teams = np.sort(team_results['Team'].unique())
rank_teams(league_table, team_list=all_teams)
Tracking Team Rankings Across Entire Season
Going back to our workflow diagram, we need to calculate and store Team Rankings at the end of each day during the season. Once we have this list for each team, we can calculate the longest streak at a single position.
# get list of days
rank_history = []
all_dates = team_results['Date'].unique()

# calculate ranks after each day there is a game
for day in all_dates:
    # get results up to current day
    dailyresults_byteam = (team_results[team_results['Date'] <= day]
                               .groupby(['Team']))

    # create league table with ranking
    # premier league ranking goes: Points, GD, GF
    league_table = (dailyresults_byteam
                        .apply(standings,
                               result_col='Result',
                               goals_col='Goals',
                               goals_opp_col='Goals_Opp',
                               points_col='Points')
                        .sort_values(by=['Points', 'GD', 'GF'], ascending=False))
    team_rank = rank_teams(league_table, team_list=all_teams)

    rank_history.append(team_rank)

# create historical ranking dataframe from list of ranks
rank_history_df = (pd.DataFrame
                    .from_records(rank_history, index=all_dates))

# Reindex and include all dates
idx = pd.date_range(start=rank_history_df.index.min(), end=rank_history_df.index.max())
rank_history_df = rank_history_df.reindex(idx, method='ffill')
rank_history_df.head()
rank_history_df.tail()
Now that we have Team Rankings across the entire season, we can adapt code found on StackOverflow (Praise Be) to find consecutive segments in the rank_history_df DataFrame.
We will also use a lambda formula found on StackOverflow (Praise Be) to output the ordinal suffix for each position (i.e. 6=6th. 3=3rd).
ordinal = lambda n: "%d%s" % (n,"tsnrhtdd"[(math.floor(n/10)%10!=1)*(n%10<4)*n%10::4])

# for each team in the league, get the length of the longest streak
for team in all_teams:
    rank_history_team = rank_history_df[team].to_frame()
    rank_history_team.columns = ['A']
    rank_history_team['block'] = ((rank_history_team.A.shift(1) != rank_history_team.A)
                                      .astype(int)
                                      .cumsum())

    streak_lengths = (rank_history_team
                          .reset_index()
                          .groupby(['A','block'])['index']
                          .apply(np.size))

    pos = streak_lengths.argmax()[0]
    max_length = streak_lengths.max()
    print(f'{team} was {ordinal(pos)} for {max_length} days')  # f-string! =)
We know that Manchester United held 6th for 104 days. This matches the output of our program so we know our function is working!
Calculating Longest Streaks For Each Season
To complete our task, we will need to run the above workflow across all seasons available on football-data.co.uk match results.
I wrote a script to download and analyze each season's data to find teams which have held static in the league table. After the script is run, it prints a list of teams with streaks >=104 days.
The code is a bit messy, but it gets the job done. We can download the script from Github and run it as follows:
$ python longest_streak.py

9394
Blackburn was 2nd for 131 days
Man United was 1st for 259 days
Swindon was 22nd for 260 days

9495

9596
Bolton was 20th for 105 days
Newcastle was 1st for 174 days

9697

9798
Man United was 1st for 175 days

9899
Nott'm Forest was 20th for 149 days

9900
Man United was 1st for 107 days
Sheffield Weds was 20th for 154 days
Watford was 20th for 114 days

0001
Arsenal was 2nd for 110 days
Bradford was 20th for 155 days
Man United was 1st for 218 days

0102
Derby was 19th for 120 days
Leicester was 20th for 137 days

0203
Arsenal was 1st for 126 days

0304
Arsenal was 1st for 105 days

0405
Chelsea was 1st for 191 days
Everton was 4th for 139 days

0506
Chelsea was 1st for 257 days
Sunderland was 20th for 191 days
Tottenham was 4th for 155 days

0607
Chelsea was 2nd for 204 days
Man United was 1st for 204 days

0708
Chelsea was 3rd for 111 days
Derby was 20th for 197 days
Fulham was 19th for 126 days
Tottenham was 11th for 114 days

0809
Everton was 6th for 128 days
West Brom was 20th for 127 days

0910
Portsmouth was 20th for 244 days

1011
Chelsea was 1st for 105 days
Man United was 1st for 127 days

1112
Man City was 1st for 119 days
Man United was 2nd for 119 days

1213
Man City was 2nd for 177 days
Man United was 1st for 177 days

1314

1415
Chelsea was 1st for 268 days
Leicester was 20th for 140 days

1516
Aston Villa was 20th for 206 days
Leicester was 1st for 116 days

1617
Man United was 6th for 104 days
Ahem. Don't let Manchester United's 104 days in 6th place distract you from the fact that Everton were 6th for 128 days in the 2008-09 Premier League season.
Note
- From the above output, we can see how competitive each PL season was on a high level. This might be a good topic for further study.
Conclusion
In this post, we took a Premier League results dataset and transformed it into a pandas DataFrame. We also created functions to make it easy to generate a standing table along with a list of each team's rank.
Finally, we ran historical Premier League matchup results through the above functions to find the longest stretch of time where a team held the same position in the league table for an extended period of time.
Comments