Fastest Way to Load Data from MongoDB into Pandas
Posted by Aly Sivji in Data Analysis
In this post, I will describe how to use BSON-NumPy to pull data out of Mongo and into pandas. While this library is still in the prototype stage, it's hard to to ignore the 10x speed improvement that comes from reading BSON documents directly into NumPy.
For this example, I will be analyzing a collection of my tweets stored in a MongoDB instance running on MLab.
Note: BSON-Numpy is under active development; API is subject to change.
What You Need to Follow Along
Development Tools (Stack)
- Python 3
- MongoDB (local or online instance)
- MongoDB C Driver
- BSON-NumPy
- PyData stack (Pandas, matplotlib, seaborn)
Code
Setting up Environment
# standard library
from collections import namedtuple
import os

# pydata
import pandas as pd
import matplotlib.pyplot as plt
import seaborn as sns
%matplotlib inline

# bson-numpy libraries
import numpy as np
from bson import CodecOptions
from bson.raw_bson import RawBSONDocument
from pymongo import MongoClient
import bsonnumpy

# other libraries
import maya
# get mongodb params from environment
mlab_uri = os.getenv('MLAB_URI')
mlab_collection = os.getenv('MLAB_COLLECTION')
Overview of Data & Schema
Twitter is a microblogging platform that allows users to post content, aka tweets, that are limited to 280 characters. There are two types of tweets: tweets you write ("original tweets") and tweets that other people write & you repost ("retweets").
Every 12 hours, an AWS Lambda function goes out and downloads my latest tweets and stores them in a Mongo collection. The script leverages the Tweepy API wrapper, which does introduce some quirks to the process.
Let's start off by looking at the data we have inside Mongo.
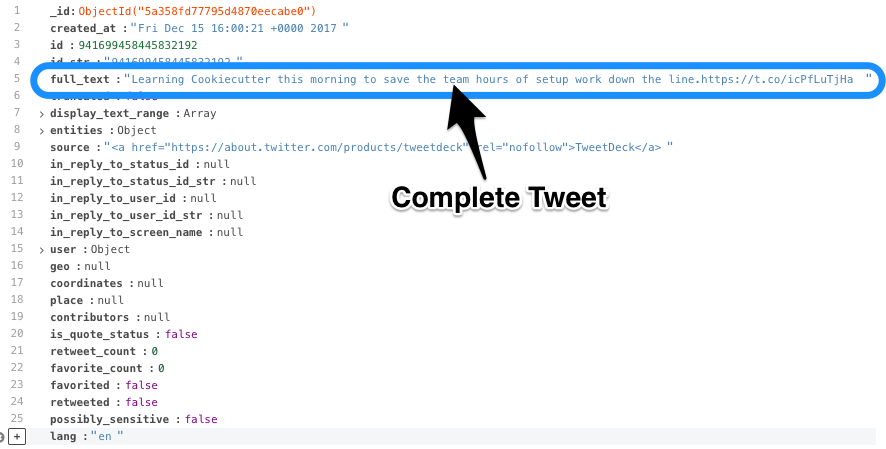
Original Tweets
Looks like we can capture the full text of the tweet from the appropriately named full_text field:
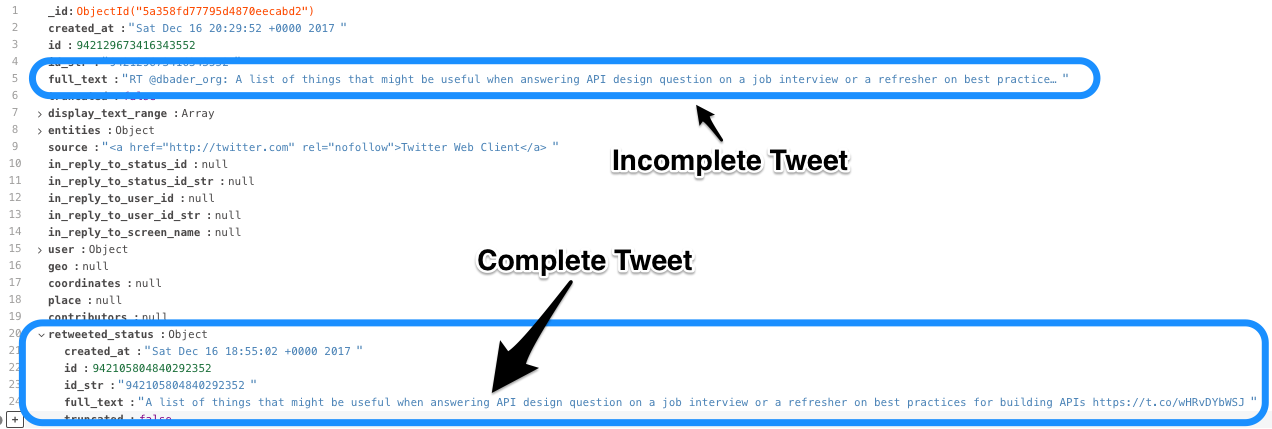
Retweets
The full_text field is cut off, but it appears that the nested retweeted_status.full_text field has everything we are looking for.
There is currently no way of handling varied documents using BSON-NumPy; we'll have to pull our data separately and combine it with pandas.
We can use the $exists operator in our query as follows:
.find({"retweeted_status": {"$exists": False}}).find({"retweeted_status": {"$exists": True}})
Downloading Data
Set up the connection to Mongo:
codec_options=CodecOptions(document_class=RawBSONDocument)
client = MongoClient(mlab_uri)
db = client.get_default_database()
collection = db.get_collection(
    mlab_collection,
    codec_options=codec_options
)
We'll have to define a np.dtype variable which specifies:
- the fields to extract from Mongo
- the NumPy types to convert to
This variable has to match the structure of the MongoDB document. If we want to pull a nested field, we will need to define a variable with a nested structure.
Original Tweets
dtype_original = np.dtype(
    [
        ('full_text', 'S400'),
        ('created_at', 'S64'),
    ]
)
# query Mongo (using a generator expression)
ndarray_original = bsonnumpy.sequence_to_ndarray(
    (doc.raw for doc in collection.find({"retweeted_status": {"$exists": False}})),
    dtype_original,
    collection.count(),
)
print(ndarray_original[:2])
tweets_original = pd.DataFrame(ndarray_original)
# convert bytes to string!
tweets_original['full_text'] = tweets_original['full_text'].str.decode('utf-8')
tweets_original['created_at'] = tweets_original['created_at'].str.decode('utf-8')
tweets_original.head()
Retweets
dtype_rt = np.dtype(
    [
        ('retweeted_status', np.dtype([('full_text', 'S400')])),
        ('created_at', 'S64'),
    ]
)
ndarray_rt = bsonnumpy.sequence_to_ndarray(
    (doc.raw for doc in collection.find({"retweeted_status": {"$exists": True}})),
    dtype_rt,
    collection.count(),
)
tweets_rt = pd.DataFrame(ndarray_rt)
tweets_rt['full_text'] = tweets_rt['retweeted_status'].map(lambda value: value[0].decode('utf-8'))
tweets_rt['created_at'] = tweets_rt['created_at'].str.decode('utf-8')
tweets_rt.head()
Combine Datasets
len(tweets_original) + len(tweets_rt)
tweets = pd.concat([tweets_rt, tweets_original])
len(tweets)
tweets['retweeted'] = tweets['retweeted_status'].notna()
tweets = tweets.drop(columns=['retweeted_status'])
tweets.describe(include='all')
Add Additional Information to Data
- Parse datatime and convert to correct timezone (assumption: most of my tweets were made around Chicago)
- Add tweet character count
ConvertTZArgs = namedtuple("ConvertTZArgs", ["dt_col", "to_timezone"])

def convert_timezone(row, *args):
    # get datetime
    dt_col = args[0].dt_col
    to_timezone = args[0].to_timezone
    dt = row[dt_col]

    dt = maya.parse(dt).datetime(to_timezone=to_timezone)
    return dt
tweets['created_at'] = tweets.apply(
    convert_timezone,
    axis=1,
    args=(ConvertTZArgs('created_at', 'US/Central'),)
)
tweets['chars'] = tweets['full_text'].str.len()
tweets.head()
Explore and Analyze Data
tweets['retweeted'].value_counts()
Investigating Number of Characters
g = sns.FacetGrid(
    tweets,
    col="retweeted",
    margin_titles=True,
    size=6,
)

g.map(
    plt.hist,
    "chars",
    bins=20,
    color="steelblue",
    lw=0,
)

tweets[tweets['retweeted'] == 0]['chars'].describe()
tweets[tweets['retweeted'] == 1]['chars'].describe()
Examining Time Between Posts
# creating function
def time_between(times):
    sorted_times = times.sort_values()
    time_between = sorted_times - sorted_times.shift(1)
    return time_between
def to_seconds(time):
    return time / np.timedelta64(1, 's')
Original Tweets
between_my_posts = time_between(tweets[tweets['retweeted'] == 0]['created_at'])
between_my_posts.describe()
to_seconds(between_my_posts).plot(
    kind='hist',
    range=(0, 100_000)
)

All Tweets (Original Tweets + Retweets)
between_all_posts = time_between(tweets['created_at'])
between_all_posts.describe()
to_seconds(between_all_posts).plot(
    kind='hist',
    range=(0, 100_000)
)

Twitter Activity Heatmap
What time of the week am I most activate on Twitter? We'll use seaborn.heatmap to explore this in more detail.
tweets['hour'] = tweets['created_at'].dt.hour
tweets['day_of_week'] = tweets['created_at'].dt.dayofweek
days_of_week = ['Sunday', 'Monday', 'Tuesday', 'Wednesday', 'Thursday', 'Friday', 'Saturday']
All Tweets (Original Tweets + Retweets)
tweets_timeline = tweets.groupby(by=['hour', 'day_of_week'])['full_text'].count()
plt.figure(figsize=(15, 15))
ax = (sns.heatmap(tweets_timeline.unstack(),
                  cmap='Blues',
                  xticklabels=days_of_week))

for label in (ax.get_xticklabels() + ax.get_yticklabels()):
    label.set_fontsize(20)

Original Tweets
tweets_timeline = tweets[tweets['retweeted'] == 0].groupby(by=['hour', 'day_of_week'])['full_text'].count()
plt.figure(figsize=(15, 15))
ax = (sns.heatmap(tweets_timeline.unstack(),
                  cmap='Blues',
                  xticklabels=days_of_week))

for label in (ax.get_xticklabels() + ax.get_yticklabels()):
    label.set_fontsize(20)

Retweets
tweets_timeline = tweets[tweets['retweeted'] == 1].groupby(by=['hour', 'day_of_week'])['full_text'].count()
plt.figure(figsize=(15, 15))
ax = (sns.heatmap(tweets_timeline.unstack(),
                  cmap='Blues',
                  xticklabels=days_of_week))

for label in (ax.get_xticklabels() + ax.get_yticklabels()):
    label.set_fontsize(20)

Conclusion
I'm more active on Twitter in the mornings and if you want me to Retweet something, best to catch me on a Sunday.
BSON-NumPy is a library that allows us to convert BSON documents into Numpy arrays. While I haven't run any benchmarks comparing it to PyMongo, I much prefer the direct conversion versus having to cobble together a DataFrame from returned documents.
Looking forward to seeing what Mongo does with this library.
Comments